Ranking 2023 NCAA Football teams objectively, Week 1 (And Week 0)
AP and Coaches’ opinion polls are fun, but often inaccurate. sTem, PASS and tWin% to the rescue.

The 2023 NCAA Football season is off to a hot start and we’re about to kick off Week 2. Based on the subjective preseason rankings of various media outlets there have already been big clashes and even bigger upsets. Clemson and TCU are the current recipients of dubious headlines in a week were most of the competition was extremely one-sided. Baylor is also vying for the crown of ineptitude after losing to Texas State. Are these teams deserving of the scorn or falsely maligned? Now that a game (Or two, more on that pesky ‘Week 0’ in a moment) are in the books for all 133 FBS teams, we can begin to rank the field not by their brands, pundits or arbitrary recruit grades, but by their real, actual in-game performances.
This ranking system focuses on evaluating several factors: Offensive and defensive performance adjusted by tempo, taking that performance rated against an objective strength of schedule, and calculating a true win percentage that doesn’t reward eating up FCS cupcakes. Just as important: there is no junk data here. This data is in no way impacted by subjective opinion, like the preseason ranks and recruit grades that taint many other well-meaning, commonly seen ranking systems.
In this system the small sample size of choatic early weeks will appear less aligned with the traditionally expected rankings. Through that chaos, unexpected contenders may bubble up to the top more obviously than in the opinion polls, though some may fade just as quickly as another week of data rolls in. Perhaps best of all, you’ll never see a 0–1 winless team sitting in the top 25. Winning matters most, especially in beating quality FBS opponents.
By season’s end, the data is more telling and has exceeded a 70% win rate across all FBS bowl games for the past 4 seasons.
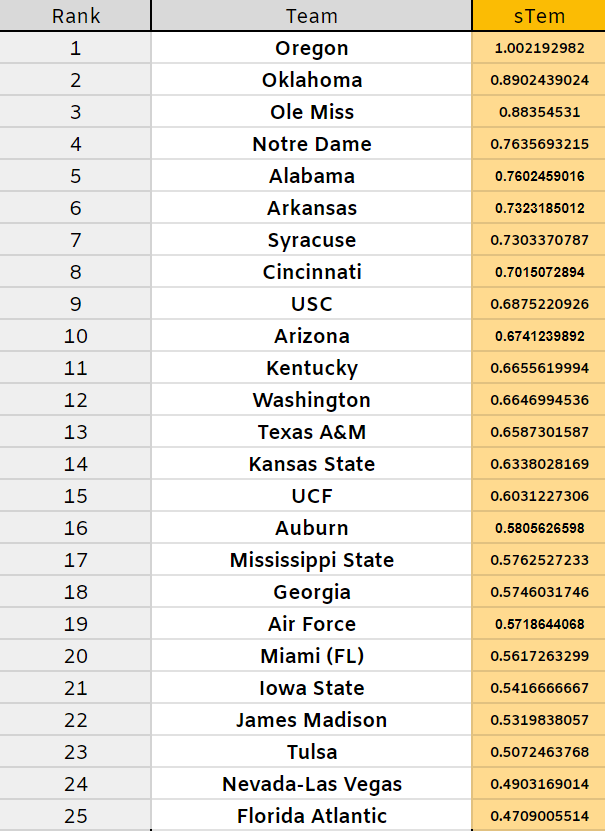
First up, performance by scoring tempo, which will be referred to as sTem. For anyone that has ever watched their team struggle against an opponent whose strategy is clock-control (Midshipmen have entered the chat), it’s important to look at factors that eliminate as many statistical outliers and aberrations as possible. Looking at how many plays a team runs/defends and what they achieve with those plays starts to paint a clearer picture of which teams are operating the most efficiently.
In Week 1, sTem tends to be on some pretty wild steroids. Just look at Oregon who scored even more points than plays they ran, which doesn’t feel like it should even be possible. This year the FCS could not keep pace with the past few years and did not manage to upset any FBS programs in the opening week, but did provide the fodder for some extremely inflated sTem scores. Here are the season’s initial ranks, including some lesser-covered teams who soundly defeated their opponents:
Next up is Performance Against adjusted Strength of Schedule, now known here as PASS. PASS takes the above performance and filters it against a team’s full schedule of opponents. A PASS score works like the Monte Carlo method for calculating strength of schedule, and factors in each opponents’ wins, tempo, yardage output on both sides of the ball, scoring margin and turnover margin. It is used as the tiebreaker in this Top 25. According to the CFP committee wins are supposed to matter most, so PASS scores are only awarded to those teams who have won a game. It may seem brutal to those who haven’t yet had success against their opponents, but multiplying that 0 against your score is an objectively fair equation. PASS will be used as the tiebreaker in our Top 25 below.
Finally, we have true win percentage (tWin%). If a team beats an FBS opponent, they recieve one win (1.00), which is business as usual. Where tWin% gets interesting is in evaluating FCS opponents, in which victories are worth a fraction of one full win. Why? To better create separation between football titans who blew the doors off of FCS teams.
Hypothetical time: Let’s say Georgia beats an FCS opponent, UT Martin, that has an otherwise dominant season and wins out in the rest of their games, while Alabama beats a late-season Chattanooga, who only wins one game. Georgia’s win against UT Martin at season’s end is worth .909 towards their win total. Bama’s win against Nooga is only worth .09 (presuming both FCS schools played 11 games). While this creates a factor a team has no control over, it serves to reward teams who play full schedules against only top-flight competition over those who do not. That’s what evaluating individual season performances is all about.
The Top 25

As promised, it’s a lot different than what you’ll see at the major polls. The teams who have already beaten their FBS counterparts all bubble to the top over those who blew up the FCS. It’s worth noting that 2-win Notre Dame actually has the highest PASS score above USC, but takes a hit for playing a winless FCS school in Tennessee State. This system now gives fans a reason to root for the FCS schools they walloped to bolster their tWin% as the season marches on.
Next week the rankings will be updated accordingly, and we’ll take a look at which teams had the biggest rise and fall. Enjoy the weekend!
For the full rankings of all 133 teams reach out to me here, or in the comments. More updates and announcements are on the way.